Mapping Economic Growth and Inequality Across China
INFO 3300 Data Visualization Final Project

Overview
This data visualization project explored regional economic and demographic trends across Chinese provinces from 2004 to 2023. Using multi-source datasets (including GRP, disposable income, government revenue, and population), we built an interactive web-based visualization that combines a choropleth map and temporal histogram to reveal patterns of growth and inequality.
The project highlights how coastal provinces like Guangdong and Jiangsu have consistently outperformed inland regions such as Gansu and Qinghai, emphasizing the geographic unevenness of China’s development.
Visual Design


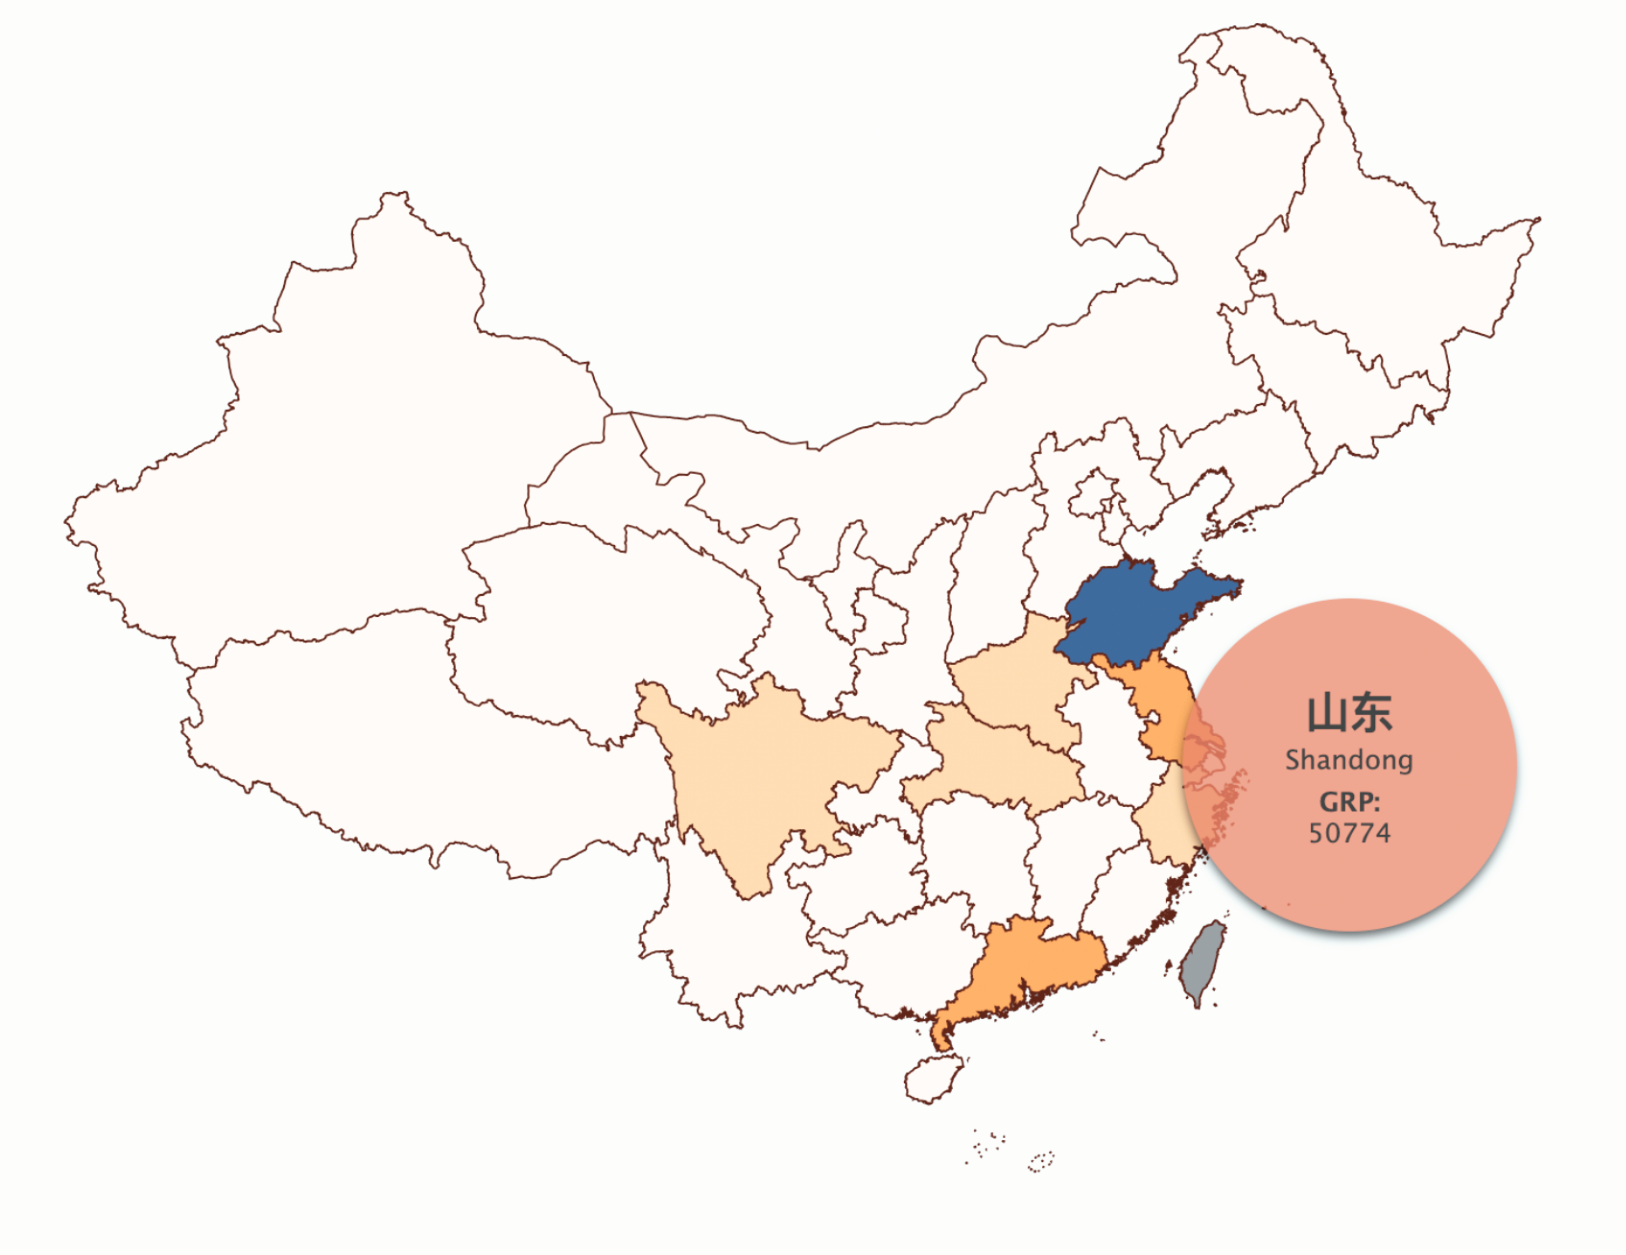
We designed the visualization around two main views:
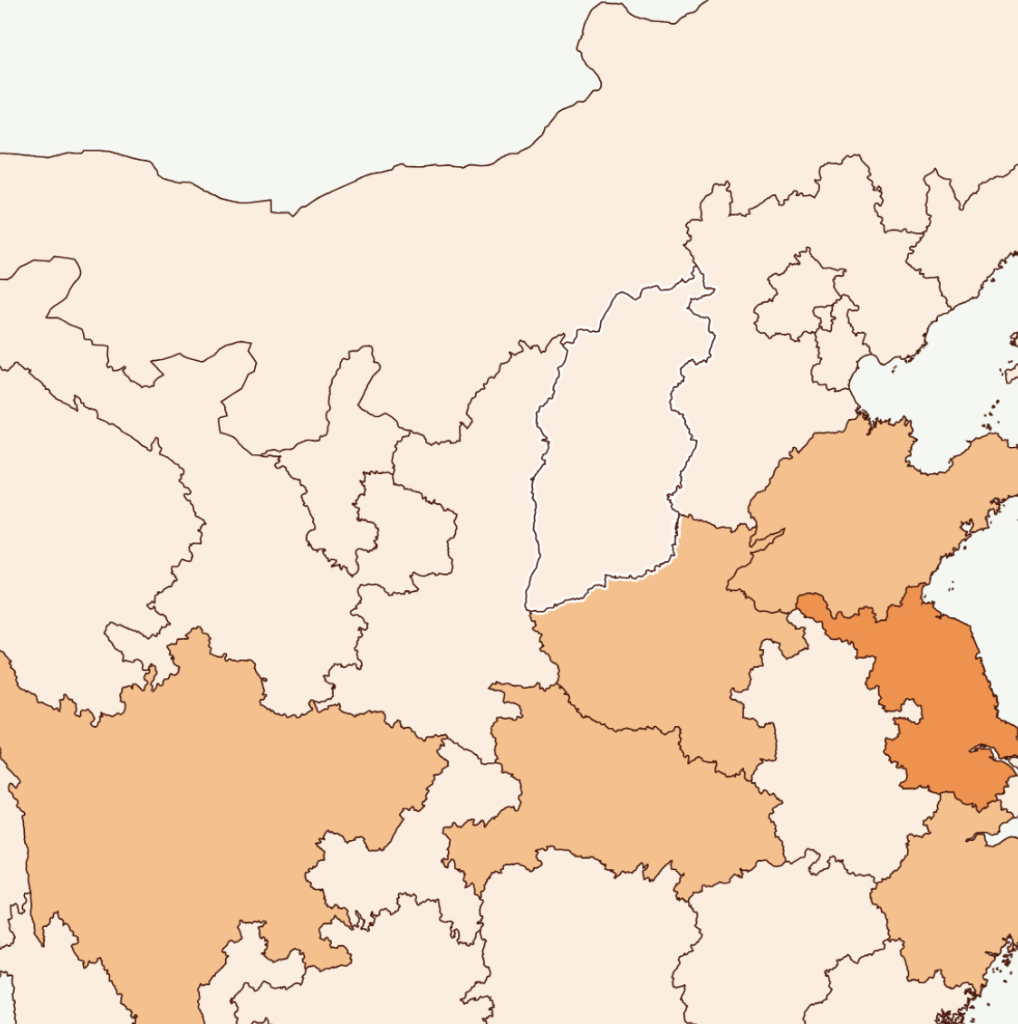
Choropleth Map: Each province is color-encoded by a selected economic metric (e.g., GRP, income).
Sequential quantile color scales reveal spatial disparities while maintaining perceptual uniformity.
Hover and click interactions enable exploration and focus.
Temporal Histogram: Displays how the chosen province’s metric changes over time.
Bar height encodes magnitude; colors follow the same theme for consistency.
Additional design elements like legends, tooltips, and a reset function were added to improve usability and accessibility.
Interactivity & User Experience
Click on a province → updates the histogram and highlights the region.
Hover over a province → reveals detailed statistics via tooltips.
Zoom & Pan → enable geographic exploration of smaller provinces.
Topic and Year Buttons → switch metrics and time ranges fluidly.
Reset Map → returns to the default national view.
These interactions were designed with discoverability and focus in mind—encouraging both structured and free exploration.


Key Insights
Economic Disparity: Persistent imbalance between coastal and inland regions.
Growth Trends: Nationwide economic growth is evident, but inequality remains.
Population vs. Productivity: Large populations don’t always equate to high GRP, underscoring the importance of industrial and resource efficiency.
Outliers: Beijing and Shanghai exhibit unusually high performance relative to their size.
Tools & Technologies
D3.js, TopoJSON, JavaScript, HTML/CSS
Data from National Bureau of Statistics of China and UN Population Division